16.2.2 How to assess pulmonary hypertension
New course: Cardiac Filling MasterClass
Pre-register now for our new course Cardiac Filling MasterClass and get free contents in advance.
To detect pulmonary hypertension it is necessary to measure pulmonary artery pressure. The most direct and exact way of measuring pulmonary artery pressure is by means of right heart catheterization. With the help of a "balloon catheter" (i.e. a Swan-Ganz catheter) which is inserted by a venous approach, the investigator will be able to quantify not only systolic, diastolic and mean pressures in the right ventricle and the pulmonary artery, but also measure pulmonary capillary wedge pressure, which correlates with left ventricular end-diastolic pressure (left ventricular preload). These measurements enable the investigator to establish the diagnosis of pulmonary hypertension and determine its degree, as well as provide a clue as to its cause. Normal pressures are listed in the following table:
| Values | |
|---|---|
| Systolic pulmonary pressure (sPAP) | 15-25 mmHg |
| Diastolic pulmonary pressure (dPAP) | 8-15 mmHg |
| Mean pulmonary pressure (mPAP) | 4-12 mmHg |
| Pulmonary capillary wedge pressure (PCWP) | 6-15 mmHg |
| Systolic right ventricular pressure (sRVP) | 15-25 mmHg |
| (End) Diastolic right ventricular pressure (dRVP) | 3-12 mmHg |
| Right atrial pressure (RAP) | 0-7 mmHg |
Pulmonary pressure is related to age and weight. A systolic pulmonary pressure (sPAP) above >40 mmHg is found in 6% of individuals older than 50 years of age and in 5% of those with a body mass index of 30. Thus, the threshold for further evaluation of pulmonary hypertension must be low, especially in young patients.
Fluctuations in pulmonary pressure may also be caused by respiration.
Pulmonary artery pressure increases with age.
16.2.2.1 Tricuspid regurgitation signal to measure pulmonary pressure
To quantify pulmonary hypertension with echocardiography it is necessary to measure the maximal tricuspid regurgitation velocity with CW Doppler. Thus, pulmonary pressures can be obtained only in the presence of a measurable TR signal. Fortunately, a certain degree of tricuspid regurgitation is frequently observed, and even more so in patients with right heart disease such as pulmonary hypertension. Tricuspid regurgitation is found in approximately 80% of patients with a systolic pulmonary pressure above >35 mmHg.
However, the degree of TR is not strictly related to pulmonary hypertension. You will encounter patients with severe pulmonary hypertension and little or no tricuspid regurgitation.
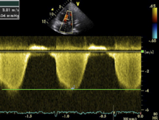
TR Doppler signal in a patient with severe pulmonary hypertension. The peak velocity is 3.8 m/sec. Applying the Bernoulli equation, the gradient across the tricuspid valve is 58 mmHg (3.82 x 4).
Optimize the 2D image first. Focus on the tricuspid valve. Then add color to guide the CW Doppler. The line should be drawn through the origin on the jet (PISA/vena contracta).

Aside from the degree of tricuspid regurgitation, the CW line should be aligned parallel to the direction of TR flow. Otherwise one would underestimate the true maximal velocity of the TR signal. While atypical views may occasionally improve the orientation of the CW Doppler to the TR jet, there will be situations in which TR simply cannot be measured. In these situations it may be helpful to use a few tricks to optimize the TR signal:
A patient with mild tricuspid regurgitation. In this setting it will be difficult to obtain an adequate TR Doppler signal.
Tricks to optimize the TR signal:
- Measure during inspiration - usually the degree of TR is greatest at this time.
- Raise the patient's legs; this will increase venous return and also the TR signal.
- Use atypical views (i.e. one intercostal space higher, a 2-chamber view of the right ventricle or even a subcostal view)
- Use right heart contrast. It will enhance the visibility of the TR signal.
To derive pulmonary pressure from the TR signal one has to use the modified Bernoulli equation:
PAP = 4 x TRvel2
This will give you the systolic gradient between the right ventricle and the right atrium. To calculate right ventricular pressure you then have to add the pressure in the right atrium.
sRVP = 4 x TRvel2 + RAP
Right atrial pressure cannot be directly measured by echocardiography. However, right atrial pressure can be estimated by various means. The most commonly used method is to look at the inferior vena cava from a subcostal view (also see Chapter 2, How to Image). With increasing pressures of the right atrium the inferior vena cava will expand. In addition, there will be less or no collapse during inspiration.
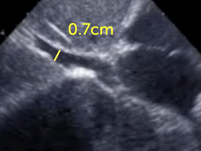
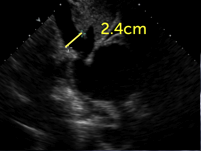
Respiratory variation in the size of vena cava inferior can also be assessed with the M-mode. However, these measurements must be interpreted with caution because respiration may also result in "out-of-view motion" of the inferior vena cava.
Based on observations, one may use the following grading scale to estimate right atrial pressure:
| IVC (diameter) | Inspiration | RA pressure |
|---|---|---|
| small (< 1.5 cm) | Collapsing | 0— 5 mmHg |
| normal (1.5- 2.5cm) | > 50% diameter reduction | 5— 10 mmHg |
| dilated (>2.5cm) | < 50% diameter reduction | 10— 15 mmHg |
| IVC + liver veins dilated | no diameter change | > 20 mmHg |
The stages overlap to a certain degree. You will encounter patients who have normal or even low atrial pressures despite a rather large inferior vena cava. The width of the inferior vena cava must also be interpreted with caution in patients under mechanical ventilation. Here one will see an inverse reaction to inspiration with collapse at expiration as opposed to inspiration. Although there is a certain degree of error involved in using the vena cava inferior, the problem is of no clinical relevance considering the fact that the magnitude of right atrial pressure contributes in small measure to the calculation of pulmonary artery pressure.
Other methods of estimating right atrial pressure, including the degree of distention of the jugular veins or tissue Doppler (E/Ea TV inflow/TV ring), are either less practical or less exact.
An indirect sign of elevated right atrial pressure is bulging of the IAS to the left.
Bulging of the interatrial septum to the left in the presence of elevated RA pressure.
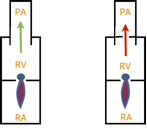
When using maximal TR velocity you should remember that what you are calculating is actually systolic right ventricular pressure. Only in the absence of pulmonary or right ventricular outflow tract (RVOT) obstruction does this calculation truly reflect pulmonary artery pressure. When a gradient across the RVOT or pulmonary artery is present, one has to subtract this gradient from the RV/RA gradient (i.e. pulmonary stenosis) to derive pulmonary artery pressure.
In general, systolic pulmonary pressure (sPAP) estimated on the echocardiogram is well correlated with pressures measured with a right-heart catheter (0.57- 0.85). However, there is a tendency to overestimate pressures with echocardiography (>10 mmHg in up to 48% of patients, especially when the Doppler ultrasound recording is of poor quality.
| Severity | sPAP |
|---|---|
| Mild | >40(35) mmHg |
| Moderate | >50 mmHg |
| Severe | >60 mmHg |
The typical TR signal is more or less symmetrical. A late peak may be indicative of reduced right ventricular dysfunction. In contrast, a very early peak and a triangular spectrum with a low maximal velocity will be found when tricuspid regurgitation is very severe. In these cases there is almost equal pressure in the right atrium and the right ventricle. In this setting right atrial pressures may be exceedingly high and impossible to estimate. It may therefore not be possible to calculate pulmonary artery pressure.
